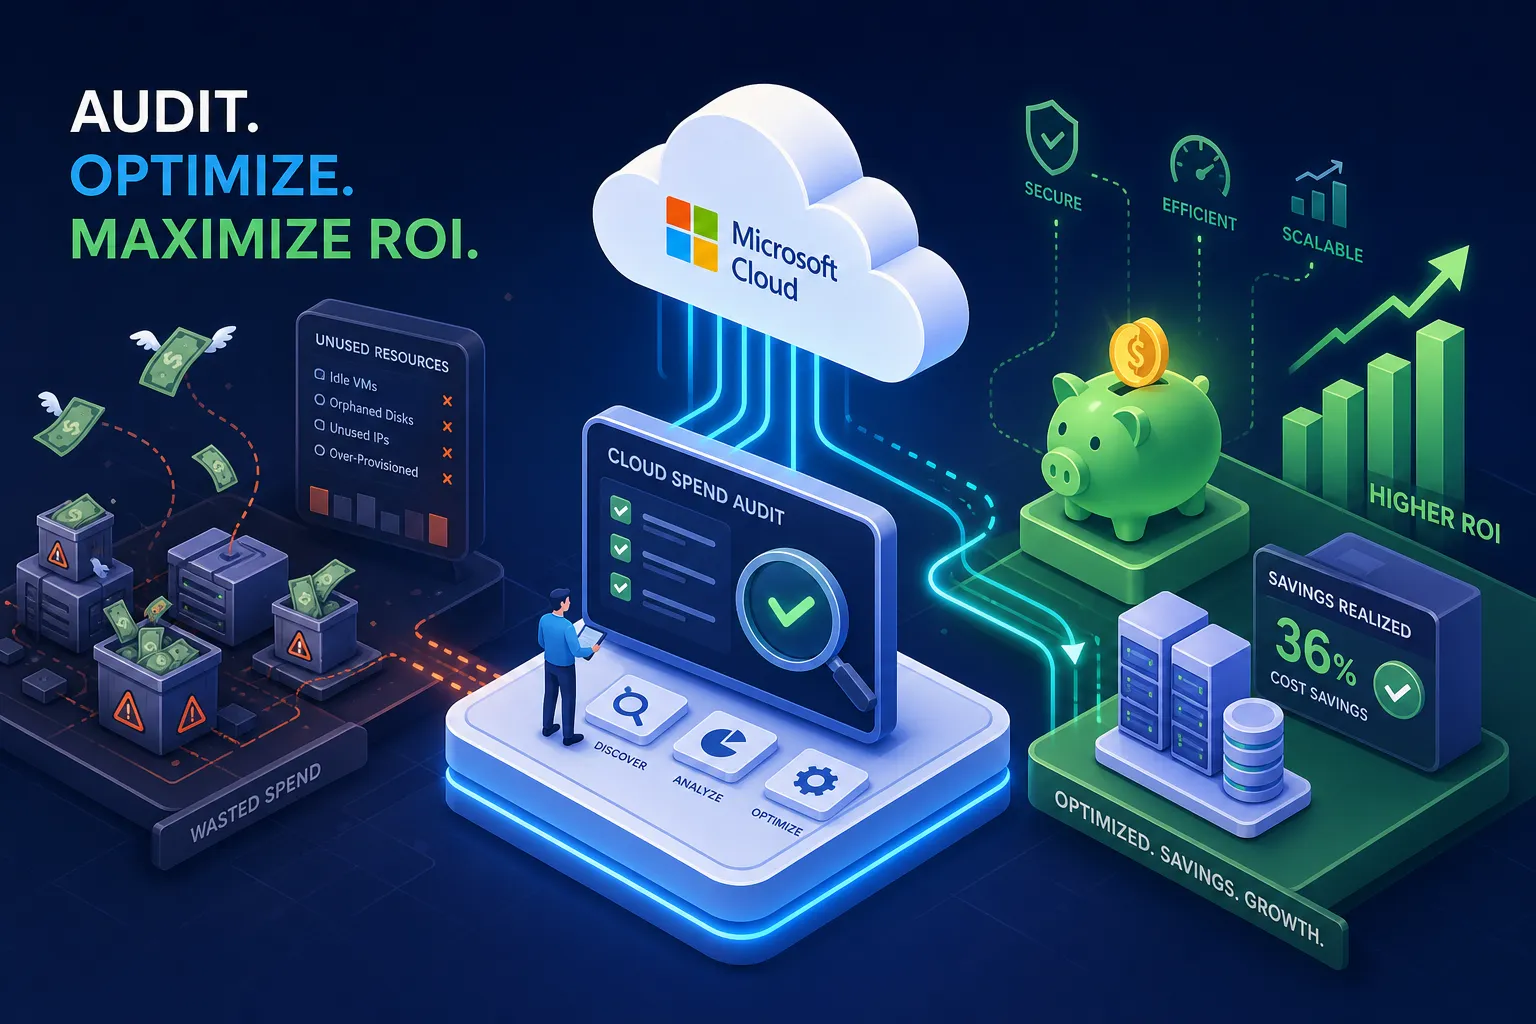
What is a realistic ROI for auditing and optimizing Microsoft cloud spend? That depends heavily on scope, but the industry-validated realized average sits at 20, 30% of total annual Microsoft spend for organizations running a structured, full-stack program. Vendors advertising 60%, 70%, even 72% savings are not lying, they’re quoting the wrong number. Finance teams at mid-market organizations reject those figures immediately, and for good reason: they reflect maximum discounts on specific compute workloads, not realized reductions across an entire Microsoft environment. If you’re building a business case for an optimization program, you need a number that will survive a CFO’s first question.
That 20, 30% benchmark holds across the Forrester Total Economic Impact (TEI) composite organization (25% in Year 1, 20% by Year 3), a WJARR peer-reviewed study (26.4% average), and the Parsimo case study (30.2% actual savings). It’s not a ceiling or a floor. It’s the defensible middle ground that shows up consistently across environments when Azure, M365, and storage are addressed together.
IT leaders now have a faster path to their own specific number. Chronom AI delivers dollar-quantified savings projections from a single read-only audit, before any program starts and before any budget commitment is required. But before you run any audit, internal or external, it helps to understand where the savings actually come from and how fast they typically arrive.
What the data actually says: separating vendor claims from realized averages
The 72% figure that appears in vendor marketing is real, but it applies to reserved instance discounts on compute, not total cloud spend. The math matters here. If compute represents 40% of your total Microsoft spend and you achieve a 60% reduction on that slice, your total portfolio savings land at roughly 24%, which falls squarely within the 20, 30% benchmark for Microsoft cloud cost reduction. That context transforms a headline number into a credible projection you can put in front of a finance team.
Unmanaged environments can push closer to 30, 60% savings in Year 1, but only when Azure, M365 licensing, and storage are addressed simultaneously. Organizations that run single-lever experiments, targeting only compute rightsizing or only license rationalization, consistently stall at 5, 8% and then see those gains erode without additional intervention. The full-stack approach is what separates a one-time win from a sustained reduction in run rate.
The Forrester TEI report is the most authoritative public benchmark for Microsoft-specific programs. Its composite organization achieved 25% cost savings in Year 1 and sustained 20% by Year 3, alongside a 24% productivity gain. WJARR peer-reviewed research independently confirmed a 26.4% average across mature FinOps organizations, with database workloads specifically delivering 4.2x ROI. These are not vendor-produced numbers. They’re the most credible public anchors available for setting internal expectations.
The four optimization levers and their realistic savings ranges
Rightsizing and idle resource cleanup
Rightsizing and idle resource cleanup together form the broadest impact lever in any Microsoft environment. Rightsizing delivers 15, 30% of compute spend by matching VM capacity to actual utilization. Idle resource cleanup, which covers orphaned VMs, forgotten non-production environments, and unused storage volumes, typically captures an additional 5, 15% of total spend. Combined, these two actions alone often account for 20, 30% of annual Microsoft spend and require minimal operational disruption to execute.
Reserved instances and Azure Savings Plans
Reserved instances and Azure Savings Plans deliver the highest percentage discounts available: 30, 72% on committed compute. These instruments only work for steady, predictable workloads where usage patterns are well understood. Applying commitments to volatile or underutilized workloads creates a different kind of waste. Organizations that actively manage reservation coverage achieve 85, 92% of eligible spend under commitment discounts, unlocking an additional 15, 20% in total savings compared to unmanaged programs.
M365 license rightsizing
M365 license rightsizing is consistently underestimated. According to Forrester and corroborating FinOps Foundation research, roughly 43% of users hold licenses above their actual usage requirements, and 8, 15% of seats are assigned to users with no activity in the past 60, 90 days. Correcting those two categories typically yields 8, 15% of total M365 spend.
Storage tiering and SharePoint lifecycle management
Storage tiering and SharePoint lifecycle management round out the picture, recovering 15, 25% of storage spend on average, with cold and archive data seeing reductions as high as 40, 90%. These Azure cost savings benchmarks hold across mid-market and enterprise environments alike when a formal tiering policy is applied consistently.
Payback periods: how fast does the investment actually return?
Rightsizing and idle resource cleanup execute within the first 30, 60 days and produce immediate run-rate reductions. Reserved instance commitments pay for themselves within 60 days at scale when applied to workloads with consistent utilization. These are the two levers to prioritize when you need a credible win to show finance teams early in the program.
The 120-day optimization arc is the most useful framework for communicating a realistic timeline. Days 1, 30 focus on inventory and tagging to establish a baseline. Days 30, 60 cover rightsizing execution, storage tiering, and reservation commits. Days 60, 90 implement policy guardrails and anomaly alerts to prevent new waste from accumulating. By Day 120, realized savings typically reach 18, 27% of annual spend when all three optimization layers are active.
Full FinOps “Run” maturity on the FinOps Foundation model takes 18, 24 months to achieve, but the majority of dollar savings are captured in the first 120 days. Organizations that reach that maturity tier sustain those reductions and layer in additional efficiencies over time, the extended timeline is about durability, not initial recovery. For IT leaders building a business case, the 90-day ROI is the most defensible number to present to a CFO, because it reflects concrete actions already taken rather than projected outcomes from a multi-year program.
What mid-market organizations actually recovered: real numbers
License rightsizing is consistently where mid-market organizations find the first recoverable spend, because license assignments rarely track headcount changes after layoffs, mergers, or rapid growth. Consider a 500-seat organization paying for E3 licenses across all users. If 30, 40% of those users only need E1 functionality, the annual savings from downgrading those seats is calculable before any audit begins. The Parsimo case study provides a real anchor for what a structured program delivers at scale: $1.39M in annual savings at a 30.2% total savings rate, starting from $4.6M in annual spend.
For mid-market organizations spending $500K annually on Microsoft, a proportionally similar outcome translates to a defensible savings range of $100K, $150K per year. That number becomes more concrete when you break it down by lever. At $500K total spend, if 40% is Azure compute and rightsizing delivers a 25% reduction on that slice, that’s $50K from compute alone. Add license rationalization at 10% of $300K in M365 spend and you’re at $80K before touching storage or reservations.
Azure VM consolidation outcomes in the mid-market range from $50K to $500K in annual recovered spend, depending on estate size and how long the environment has gone without a formal review. The Gorilla Logic case study showed a 90% cost reduction via rightsizing on specific workloads; the WJARR average sits at 26.4% across an entire estate. Both numbers are real, the difference is scope. The 90% figure reflects a targeted workload optimization; the 26.4% reflects a mature program running across every layer of Microsoft spend.
In-house audit vs. hiring external help: the cost-benefit math
Fixed-fee assessments from boutique FinOps consultancies run $25,000, $60,000 for a two-to-four-week engagement. Enterprise-scale audits from large firms can reach $120,000. Gain-share models, typically 15, 30% of verified savings, shift the upfront risk but create ongoing fee obligations that reduce net ROI, especially in the first year when the largest savings are captured.
For organizations with 250 or more seats, the Microsoft Commerce Incentive (MCI) program is worth verifying before signing any vendor contract. The program can cover up to $26,000 of a partner-delivered assessment at zero cost to the customer, provided the organization has active M365 licensing, falls within the 250, 5,000 employee range, and has not completed a partner assessment in the current Microsoft fiscal year. That’s a detail that frequently goes unmentioned during vendor conversations.
Chronom AI restructures the ROI equation before you spend a dollar. Rather than committing $25K, $60K to a fixed-fee engagement with estimated ranges, IT leaders can run Chronom AI’s free read-only audit and receive dollar-quantified savings projections across Azure compute, M365 licensing, and storage in a single report. That flips the traditional audit decision: instead of justifying the cost of an audit to finance with industry benchmarks, you walk into the budget conversation with an actual dollar figure already identified. The SOC 2-compliant, no-credit-card, read-only access model eliminates the security friction that typically slows enterprise procurement, which means the ROI conversation starts faster than any traditional engagement model allows.
Setting your ROI target: what a realistic Microsoft cloud spend audit delivers
The realistic ROI framework is straightforward. Expect 20, 30% of annual Microsoft spend for a structured full-stack program, with 18, 27% achievable within the first 120 days when all three optimization layers are addressed. If your organization spends $500K annually on Microsoft, the range to present to finance is $100K, $150K per year, with the first material savings appearing within 30, 60 days of implementation. At $1M in annual spend, that range scales to $200K, $300K.
The highest-impact move before setting any internal target is replacing industry percentages with your own specific dollar figure. Chronom AI surfaces the actual savings opportunity in your environment across every layer of Microsoft spend, Azure compute, M365 licensing, storage, and Marketplace commitments, giving IT leaders a concrete number to bring to the budget conversation. Peer-reviewed research, Forrester benchmarks, and real-world case studies consistently confirm that a structured Microsoft cloud spend audit delivers meaningful, measurable ROI. The remaining question is how much is sitting in your specific environment. Run the free audit and find out.